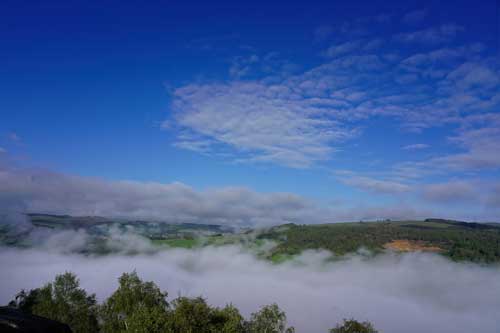
Baslow and Curbar Historic Weather
How hot has the Peak District ever been? How cold? And what was the weather like on the day you were born? This page brings together more than 85 years of daily weather for Curbar and Baslow, in the Derwent Valley in the heart of the Peak District National Park, and over 140 years of records from Sheffield’s Weston Park weather station, one of the longest-running in the UK.
At the top you’ll find the live conditions from our own Peak District weather station, compared with what’s normal for today. Below that you can look up any date since 1940, explore any year, and see how the local climate has changed over the decades.
Peak District weather records since 1940
These are the most extreme days recorded for Curbar since 1 January 1940.
| Record | Value | Date | What happened |
|---|---|---|---|
| 🌡️ Hottest day | 36.3 °C | 19 July 2022 | The UK’s record-breaking heatwave, when 40.3 °C was reached in Lincolnshire |
| ❄️ Coldest night | −13.9 °C | 24 February 1947 | The great winter of 1947, one of the harshest the UK has known |
| 🌧️ Wettest day | 66.5 mm | 20 October 2023 | Storm Babet, which caused severe flooding across Derbyshire |
| 🌬️ Strongest gust | 84 mph | 13 January 1984 | A severe winter gale |
The second coldest night came on 23 January 1963, at −13.7 °C, during the Big Freeze of 1962–63, and 1963 is still Curbar’s coldest year since 1940, with an average of just 7.4 °C. Before 2022, the hottest days on record reached 31.2 °C, in 1990 and again in 2019, so the 2022 heatwave beat the old record by more than 5 degrees.
Warmest, coldest, wettest and driest years in Curbar
- Warmest years: 2022 (10.3 °C average), 2025 (10.2 °C), 2006, 2014 and 2023 (all 10.0 °C).
- Coldest years: 1963 (7.4 °C), 1962 (7.8 °C), 1942, 1979 and 1986 (all 7.8 to 7.9 °C).
- Wettest years: 2012 (1,300 mm of rain) and 2000 (1,280 mm).
- Driest years: 1955 (667 mm) and 1947 (675 mm).
- Frostiest year: 1979, with 90 nights below freezing. The fewest was 1974, with just 17.
How the Peak District climate has changed
The Peak District is warming. Curbar’s average temperature has risen from about 8.7 °C in the 1940s to 9.9 °C in the 2020s so far. The 30 years from 1940 to 1969 averaged 8.6 °C, the 1991 to 2020 period 9.3 °C, and the last ten years (2016 to 2025) 9.8 °C.
Frosts are becoming rarer too. In the 1940s Curbar had around 56 frosty nights a year; in the 2020s so far it has averaged 34.
The change shows up in the daily records as well. For each date of the year we know the warmest day since 1940. Since 2000, 178 of those 366 date records have been set, while only 47 of the coldest-night records for each date have been set in the same time. And 2026 has already set the record high for 18 different dates, more than any other year since 1940.
What’s normal for the Peak District?
Using the standard 1991 to 2020 averages, Curbar gets about 950 mm of rain a year, spread fairly evenly through the seasons. July is the warmest month, with an average daytime high of 19.4 °C, and February has the coldest nights, averaging 1.4 °C. The high moors, such as Kinder Scout and Bleaklow, are colder and wetter than the valleys.
Sheffield weather records since 1883
Sheffield’s Weston Park weather station, about 15 km from Curbar, has monthly records going back to 1883, giving a long view of the local climate.
- Warmest years: 2025 (11.33 °C), 2022 (11.31 °C) and 2023 (11.24 °C), the top three in over 140 years.
- Coldest year: 1892 (7.94 °C).
- Wettest year: 2012 (1,146 mm). Driest year: 1887 (491 mm).
- Wettest month: June 2007, with 285.6 mm, during the floods that hit Sheffield that summer.
- Hottest month: July 2006, with an average daytime high of 25.6 °C. It was also the sunniest month on record, with 290.8 hours of sunshine.
- Sunniest year: 1989, with 1,725 hours of sunshine.
Sheffield’s average temperature has risen from 9.06 °C in 1884 to 1913 to 10.89 °C in 2016 to 2025, and its frosty nights have halved, from 43 a year to 21.
Frequently asked questions
What is the hottest temperature ever recorded in the Peak District?
For Curbar in the Derwent Valley, the hottest day since 1940 was 19 July 2022, at 36.3 °C, during the UK’s record-breaking heatwave.
What is the coldest temperature recorded in the Peak District?
The coldest night in Curbar since 1940 was 24 February 1947, at −13.9 °C. The Big Freeze of 1963 came close, with −13.7 °C on 23 January 1963.
What was the wettest day in the Peak District?
20 October 2023, when Storm Babet brought 66.5 mm of rain to Curbar in a single day and caused severe flooding across Derbyshire.
Is the Peak District getting warmer?
Yes. Curbar’s average temperature has risen from about 8.7 °C in the 1940s to 9.9 °C in the 2020s so far, and frosty nights have fallen from around 56 a year to 34. Sheffield’s records show the same trend since the 1880s.
How much rain does the Peak District get?
Curbar, in the Derwent Valley, averages about 950 mm of rain a year (1991 to 2020). The high moors receive considerably more.
Can I find out what the weather was like on my birthday?
Yes. Use the date search in the weather history above to look up any date since 1940. It shows the average and record temperatures and rainfall for that date, and a summary of the whole year.
Does this weather history cover Baslow?
Yes. Baslow, Curbar, Calver and Froggatt all sit within a couple of miles of each other in the Derwent Valley, below Baslow and Curbar Edges, so the records and averages on this page apply to all of them. Our live weather station is in Curbar.
Where does this weather data come from?
The Curbar history comes from the ERA5 climate reanalysis, provided by Open-Meteo, which combines historical weather observations into a consistent daily record from 1940. Sheffield’s figures are the Met Office’s historic station data for Weston Park. Live readings come from the Barn Owl Live weather station in Curbar.
About the data
The Curbar figures are modelled for a grid square covering Curbar, at 142 m above sea level, so frosts in sheltered spots can be a degree or two colder than shown. Recent Sheffield figures can be provisional until the Met Office finalises them.
Historical data: Open-Meteo / ERA5 (open-meteo.com, CC BY 4.0). Contains Met Office data © Crown copyright, used under the Open Government Licence.
See today’s conditions and the 5-day outlook on our live Peak District weather forecast.
The seasons at Baslow and Curbar Edge
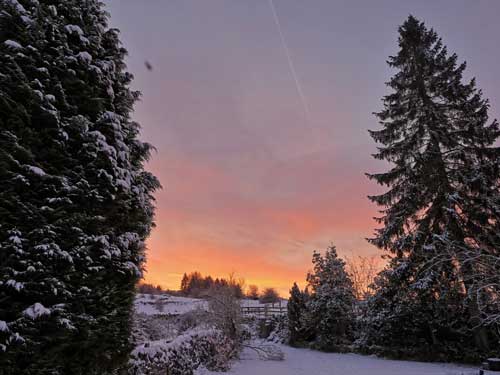
The Peak District changes completely through the year, and the weather shapes everything, from the landscape to the wildlife that lives here. I took all of these photos myself, while out running or walking my two fox red Labradors along Curbar Edge and in the valley below, between Baslow, Curbar, Calver and Froggatt, close to our weather station. Being out in all weathers, every season, means seeing the landscape change and catching moments like these. These villages sit within a couple of miles of each other in the Derwent Valley, so the weather history on this page is just as much Baslow’s story as Curbar’s.
❄️ Winter: when the ponds freeze over
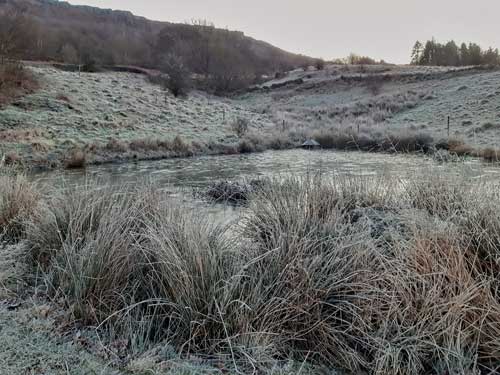
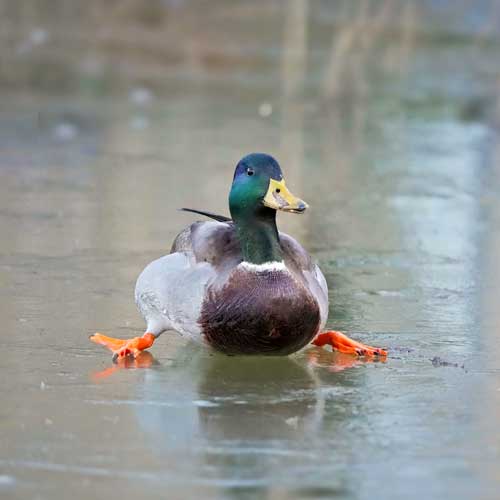
Winter around Baslow and Curbar can be hard on wildlife. Our records show the valley averaged around 56 frosty nights a year in the 1940s, and still around 34 a year in the 2020s so far. The coldest night since 1940 was −13.9 °C, on 24 February 1947. When the ponds freeze solid, ducks and other waterbirds can’t reach their food, and have to move to running water or go hungry.
🦋 Spring and summer: new life and fiery skies
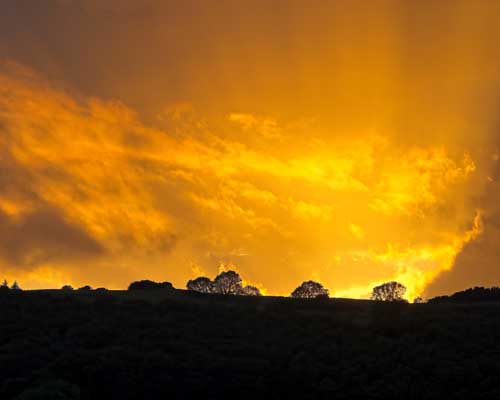
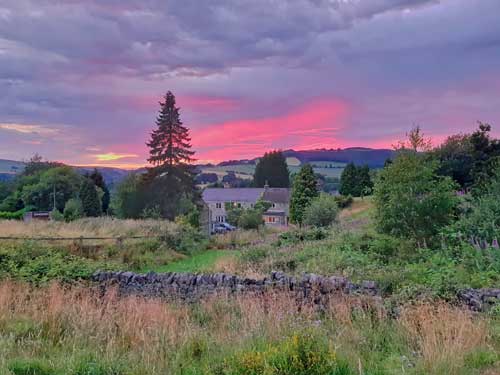
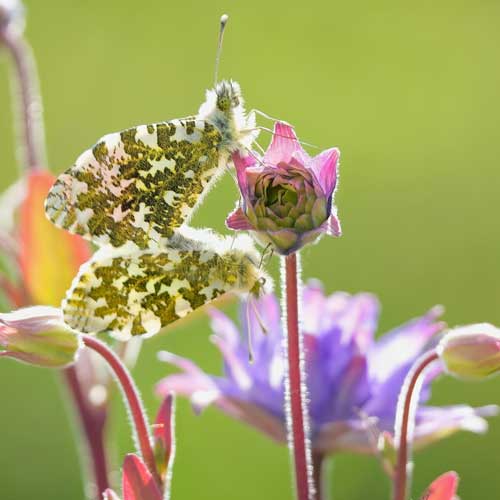
As the days lengthen and the frosts ease, the valley comes back to life. Butterflies such as the orange-tip are among the first signs of spring, flying from April into June. Summer then brings the longest days and some spectacular sunsets over the hills. It can bring real heat too: on 19 July 2022, the valley around Baslow and Curbar reached 36.3 °C, its hottest day since records began in 1940, beating the previous high of 31.2 °C by more than 5 degrees.
🍂 Autumn: golden colours on the edge
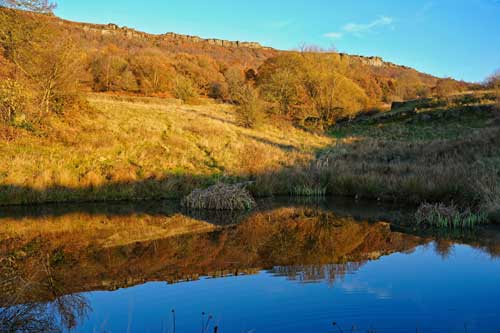
Autumn turns the bracken and birches below Curbar and Baslow Edges to gold, and still mornings bring mist to the valley. It can also bring the heaviest rain: Storm Babet dropped 66.5 mm on the area on 20 October 2023, the wettest day since 1940.
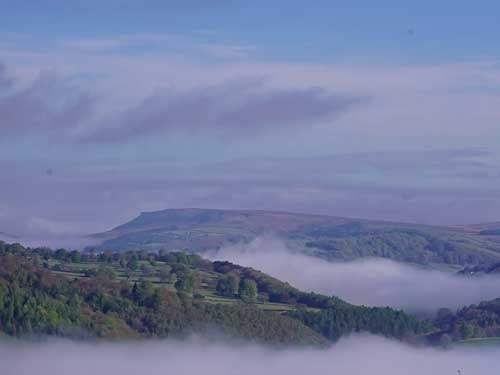
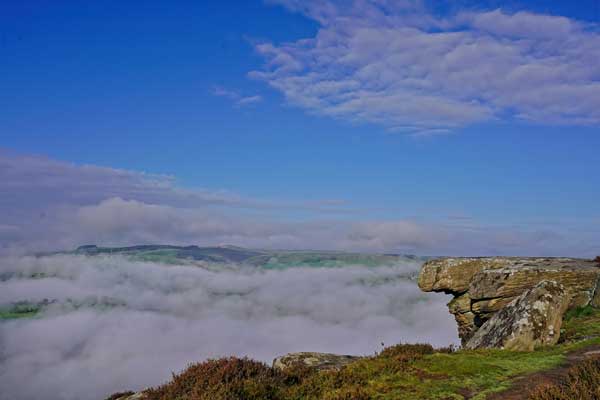
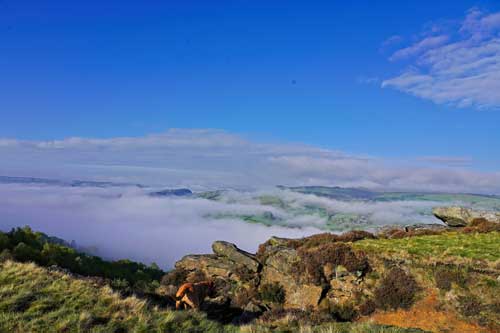
☁️ Cloud inversions: above the clouds at Baslow and Curbar Edge
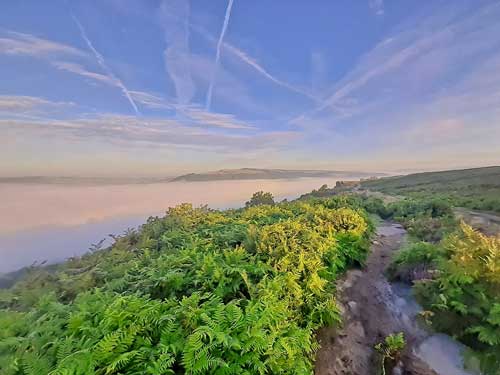
One of the most magical sights in the Peak District is a cloud inversion. On clear, calm nights, cold air drains down the hillsides and settles in the bottom of the valley. Normally air gets colder the higher you go, but now it’s the other way round, so it’s called a temperature inversion. Moisture in the cold valley air condenses into fog, leaving Curbar Edge in bright sunshine above a sea of cloud. They’re most common on still mornings in autumn and spring, often when high pressure brings settled weather.
You’ll notice there are several inversion photos here, and that’s no accident. Curbar Edge and its neighbour Baslow Edge are among the best places in the Peak District to see them. The edges rise steeply above the Derwent Valley, so on the right morning you can stand on the gritstone in sunshine and look down on the cloud filling the valley below, with Baslow, Curbar and Calver hidden somewhere underneath. Inversions form here often, and photographers travel from miles away to catch one, many of them arriving before dawn to be on the edge as the sun comes up. If you’d like to try, look out for a clear, still night with little wind, then head up early the next morning.
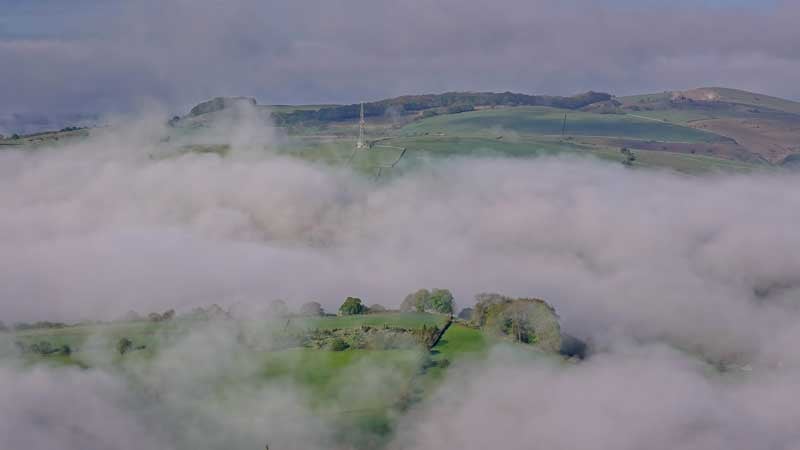
All photos © Barn Owl Live, taken in the Peak District on runs and walks with my two fox red Labradors.